A chartplotter represents one of the most powerful tools available on a modern boat. It combines GPS positioning with electronic nautical charts, giving you a real-time picture of exactly where you are, where you’re heading, what hazards lie ahead, and how to navigate safely around obstacles. For boaters transitioning from paper charts or learning navigation from scratch, learning to read a chartplotter properly improves safety dramatically, increases confidence on the water, and fundamentally changes how you approach navigation.
However, the technology can feel intimidating at first. Screens show dozens of data points simultaneously. Symbols cover the display. Overlays add complexity. Settings seem endless. Many boaters use only basic functions, missing powerful capabilities their equipment provides. This comprehensive guide explains how to interpret every element of a chartplotter screen, understand nautical chart symbols, use waypoints and routes effectively, and master advanced features. Whether you have a Garmin, Raymarine, Lowrance, Simrad, or other major manufacturer’s unit, the core principles remain consistent across platforms.
Understanding Your Chartplotter’s Main Screen
The chartplotter’s main display serves as your primary navigation window, combining multiple information streams into a unified display. Understanding what you’re looking at during each moment on the water separates competent operators from those simply staring at screens.
Chart display area:
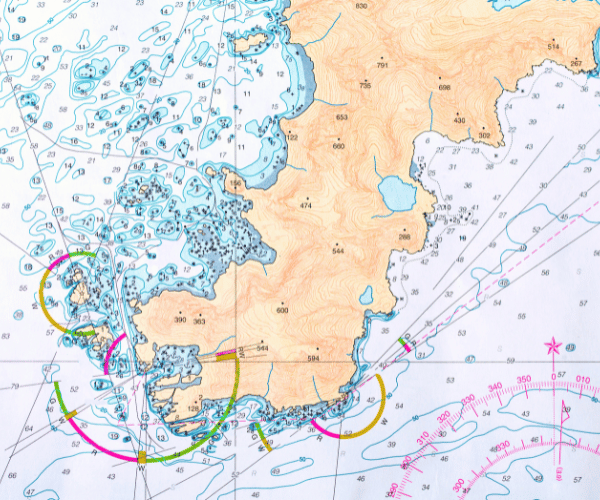
The center of your screen shows the nautical chart itself. Color coding conveys water depth information instantly. Deep water typically appears white or very light blue. Progressively shallower areas transition through darker blue shades. Land masses display in tan, green, or gray depending on how your unit renders terrain. Vegetation and forests may show in different colors than urban areas. Sandy beaches often appear differently than rocky coastlines.
Contour lines overlay the chart showing changes in water depth. Closely spaced contour lines indicate steep drop-offs where water depth changes dramatically over short distances. Widely spaced contour lines show gradual bottom slope changes. Understanding these contours helps you recognize where hazards might hide.
Vessel icon and heading indicator:
Your boat’s position appears as a distinctive arrow, boat symbol, or triangle on the chart. The direction this icon points indicates your boat’s current heading (where your bow is pointing). Some units show your actual position slightly behind the icon, accounting for the water displaced by your vessel. Understanding the precise meaning of your boat’s icon prevents confusion about your actual location versus where you’re pointing.
Scale bar and zoom levels:
Usually located in a corner of the screen, the scale bar tells you how much real-world distance one inch on the screen represents. This critical reference changes as you zoom in and out. At zoom level showing 10 nautical miles per inch, you see big-picture route information but lose detail for tight navigation. Zooming to 0.1 nautical miles per inch shows incredible detail but limits your perspective to a small area. Experienced operators zoom frequently, using high-level views for planning and detailed views for precise navigation through hazardous areas.
Customizable data boxes:
Floating information boxes display critical navigation data that updates continuously. Speed over ground (SOG) shows your actual movement speed accounting for current. Course over ground (COG) shows your actual direction of travel, often differing from your heading if current pushes you sideways. Depth displays water depth from your sounder. GPS coordinates show your position. Distance to next waypoint and estimated time of arrival appear automatically when you’re following a route. Heading indicates where your boat’s bow points. Wind speed and direction display if your unit has wind sensors.
You can usually customize which data appears and where. Set up data boxes showing the information you reference most frequently. Remove less-relevant data to avoid screen clutter.
Compass rose or north arrow:
Most chartplotters include a compass rose or north arrow showing map orientation. This becomes particularly important when choosing between “Course Up” mode (your direction of travel always points up the screen) versus “North Up” mode (north always points up). Each mode has advantages. Course Up mode makes route following intuitive. North Up mode feels more natural when comparing to paper charts. Experiment with both to discover your preference.
Decoding Nautical Chart Symbols: The Language of Navigation
Chartplotters use standardized symbols that appear consistently across different manufacturers and regions. These symbols convey critical information about hazards, navigation aids, and bottom conditions. Learning them prevents confusion and improves safety dramatically.
Buoys and navigational markers:
Red and green buoys follow the standardized “Red Right Returning” rule when you’re heading into ports, harbors, or navigating inland waterways. Red markers should be on your right (starboard) side when entering. Green markers belong on your left (port) side. Opposite rules apply when leaving (red on left, green on right). Numbers on buoys help identify specific markers on your chart. Shapes matter too. Red buoys are typically conical. Green buoys are usually cylindrical. Red and green striped buoys mark channel dividers.
Depth soundings and contours:
Small numbers scattered across water areas represent depth soundings at mean lower low water, a standardized tidal reference. These numbers don’t represent current depth but instead show charted depth. You must account for current tides to calculate actual water depth. Contour lines connect points of equal depth, showing bottom slope visually. Closely packed contour lines indicate steep underwater slopes. Widely spaced lines show gradual depth changes.
Hazards and underwater obstructions:
Wrecks appear with distinctive symbols showing the wreck’s approximate location and depth. Rocks and submerged obstacles have specific symbols. Cables crossing waterways appear as lines with special markings. Submerged pilings and other hazards have designated symbols. Always check your chartplotter’s symbol legend to understand exactly what each symbol represents on your specific unit.
Navigation aids and lights:
Lighthouses, beacons, and daymarks all have distinctive symbols with characteristics displayed (flashing pattern, color, number). Understanding the information helps you positively identify specific aids during navigation. Light characteristics like “Fl R 4s” (flashing red every 4 seconds) help you identify specific lights at night.
Marinas and anchorages:
Special icons mark marinas, fuel docks, and anchorage areas. Hovering over or selecting these icons usually displays additional information about available services. Some chartplotters integrate detailed marina information showing fuel availability, slip dimensions, facilities, contact information, and reviews.
Land features and hazards:
Beaches, cliffs, piers, bridges, and other land features appear with specific symbols. Power lines, buildings, and structures above water display as well. Understanding these symbols helps you navigate near land safely and identify visual landmarks for position verification.
Spend time on your chartplotter zooming in on familiar waters, identifying symbols, and cross-checking them against your chart legend. This practice builds automatic recognition making actual navigation intuitive.
Creating and Using Waypoints for Efficient Navigation
Waypoints represent digital markers for important locations. They form the practical foundation of modern navigation.
Creating waypoints:
The simplest method is pressing a “Mark” or “Waypoint” button when your boat reaches an important location. Your chartplotter records the GPS position, creating a waypoint you can name and organize. Alternatively, you can enter exact coordinates manually if you know the position you want to mark. Most units allow naming waypoints descriptively (“Favorite Fishing Spot,” “Safe Anchorage,” “Fuel Dock”) making them easy to identify later.
Organizing waypoint collections:
Group related waypoints together (fishing spots, anchoring locations, hazards). This organization helps you quickly find relevant waypoints when needed. Some units allow color-coding waypoints or assigning icons, improving visual organization on your chart display.
Navigating to waypoints:
Select a waypoint and choose “Navigate to Waypoint” or similar command. Your chartplotter calculates the bearing and distance, displays this information constantly, and can provide steering guidance. Some advanced units offer autopilot integration allowing hands-off navigation once you initiate waypoint navigation.
Using waypoints for recurring routes:
Mark important waypoints along routes you navigate repeatedly. Your chartplotter remembers these positions, allowing you to return to identical locations season after season. Fishing spots marked as waypoints become permanently recorded in your boat’s memory.
Building and Following Routes for Complex Navigation
Routes represent sequences of waypoints connected together in order.
Creating routes:
Select multiple waypoints in sequence and create a route connecting them. Your chartplotter calculates the course between each consecutive waypoint. The route displays as a line on your chart showing the path. You can edit routes, adding or removing waypoints, adjusting the sequence, or changing leg names.
Following routes:
Activate a route and your chartplotter guides you from waypoint to waypoint automatically. Arrival alarms notify you when reaching each waypoint. Distance to next waypoint displays continuously. Some units suggest course corrections if you drift off the planned route.
Legs and leg information:
Each segment between consecutive waypoints represents a “leg.” Your chartplotter displays information about each leg (distance, recommended course, current status). Understanding leg-by-leg information helps you navigate complex routes through multiple turns and passages.
Advanced Features: Sonar, Radar, and AIS Integration
Modern chartplotters integrate multiple data sources beyond simple chart display.
Sonar and fish finder integration:
Sonar data displays overlaid on your chart or in split-screen configuration. You see real-time depth directly beneath your boat, underwater structure, and fish presence. This integration allows you to identify productive fishing areas while monitoring water depth for safe navigation. Combining sonar information with chart depths provides comprehensive water awareness.
Radar overlay capabilities:
Weather radar or marine radar data overlays on your chart view. Radar helps identify rain areas, storms, and other precipitation you want to avoid. Marine radar overlays show other radar-equipped vessels and larger obstacles. Understanding radar presentation on your chartplotter improves collision avoidance and weather awareness.
AIS (Automatic Identification System) display:
AIS-equipped commercial vessels and other AIS targets appear on your chart with their name, speed, course, and closest point of approach. AIS integration transforms your chartplotter into a collision avoidance tool. Alarm functions alert you to vessels approaching dangerously. Understanding AIS limitations (requires line-of-sight radio signals, range typically 20-30 nautical miles) prevents over-reliance on this feature.
Essential Settings and Customization for Your Boating Style
Spending time customizing your chartplotter dramatically improves its usefulness during actual boating.
Units and measurement standards:
Set units to your preference (knots and feet, knots and meters, kilometers). Choosing units you think naturally in prevents mental conversion errors during navigation.
Display orientation choices:
“Course Up” mode keeps your heading pointed up the screen, making route following intuitive. “North Up” mode keeps true north pointing upward, matching paper chart orientation. Try both modes and choose based on personal preference.
Alarm configuration:
Set shallow water alarms to depths slightly deeper than your boat’s draft. Anchor drag alarms alert you if your boat moves while anchored. Arrival alarms notify you when approaching waypoints. Configuring these alarms ensures you receive critical warnings.
Night mode and brightness adjustment:
Night mode reduces blue light helping preserve night vision while keeping your chartplotter readable. Brightness adjustment helps visibility in bright sunlight and dim cabin conditions.
Chart preferences:
Some units allow adjusting which information displays on charts. Remove clutter by hiding non-essential data. Emphasize information relevant to your boating style.
Mobile Navigation Apps as Modern Alternatives
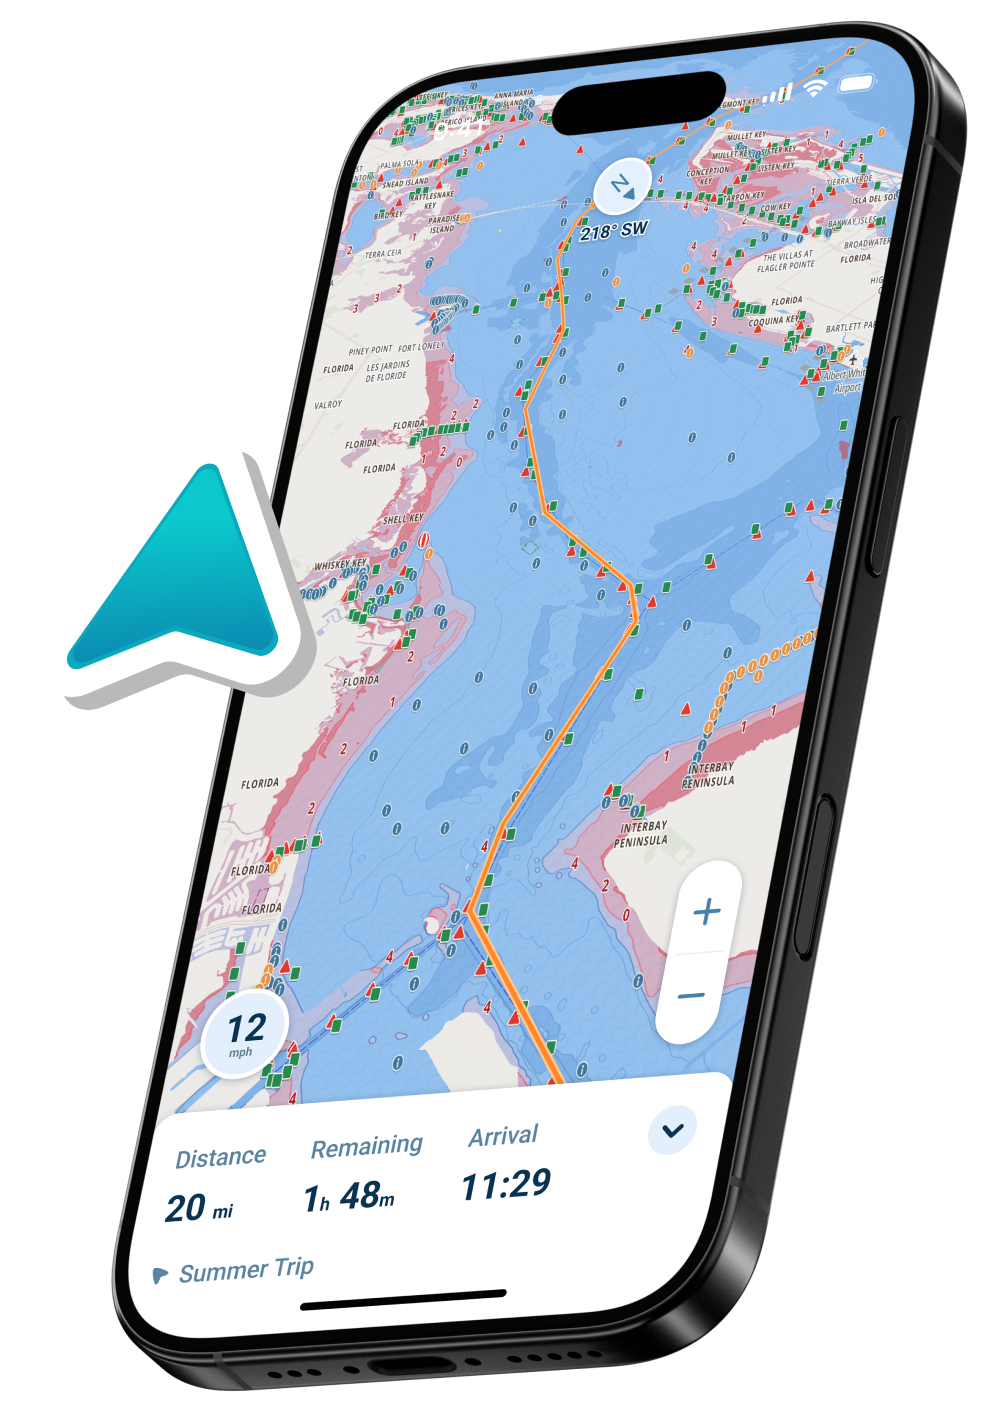
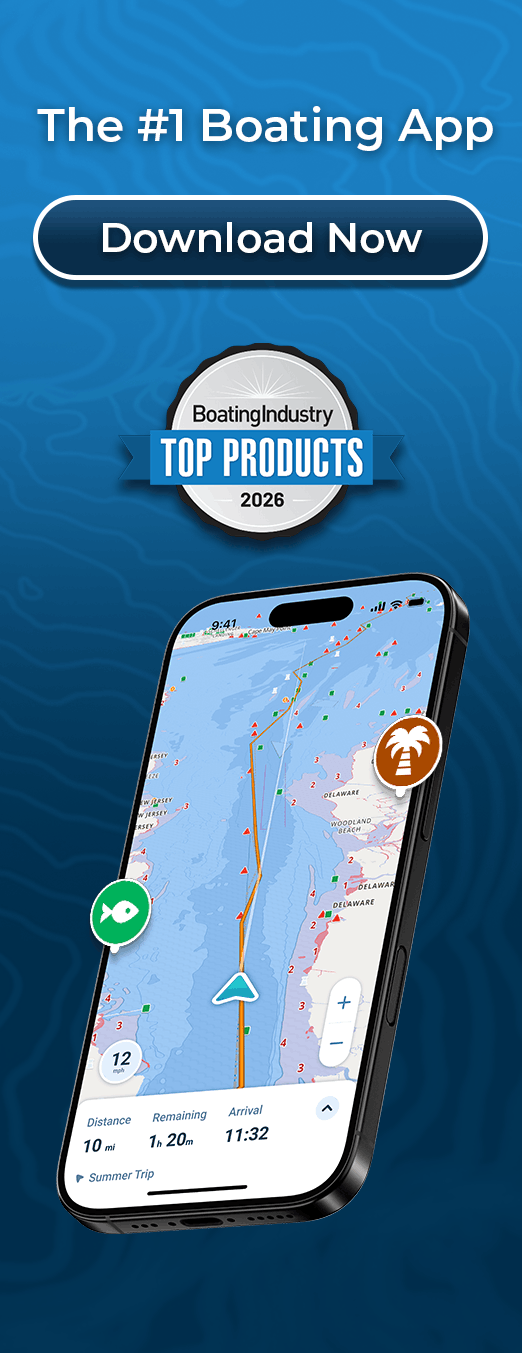
Dedicated chartplotters provide large displays, dedicated button controls optimized for marine use, and always-on functionality. However, modern mobile navigation apps offer compelling alternatives, particularly for smaller boats or as backup systems. These apps combine electronic charts with real-time data integration, automatic updates, and additional features like draft-aware navigation unavailable on many traditional chartplotters. Testing multiple navigation methods helps you discover the combination serving your specific boating needs best.
Practical Tips for Effective Chartplotter Use
Cross-reference everything:
Never rely solely on your chartplotter. Combine electronic information with visual assessment, depth sounder confirmation, and local knowledge. The best navigators use technology as a tool supporting judgment rather than replacing it.
Update charts regularly:
Obtain chart updates at least annually, more frequently if you boat in areas with rapid changes like tidal inlets or busy commercial harbors. Outdated charts create navigation hazards.
Learn your unit thoroughly:
Read your chartplotter’s manual completely. Practice in familiar waters. Experiment with different display modes and settings. Understanding your equipment’s capabilities and limitations makes you a more effective navigator.
Verify positions visually when possible:
Use visual landmarks to confirm your chartplotter’s position. This cross-verification catches GPS errors and builds confidence in your navigation.
Plan routes before departure:
Marking waypoints and planning routes before heading out prevents distraction during actual navigation. Well-planned routes reduce cognitive load while operating your boat.
FAQ
What’s the difference between vector and raster charts?
Vector charts are digital and scalable without losing quality at any zoom level. Raster charts are scanned images of traditional paper charts. Modern chartplotters primarily use vector charts offering superior functionality. Some units allow viewing both types, with users choosing based on preference.
Should I use “Course Up” or “North Up” display orientation?
Course Up (your direction of travel always points up the screen) makes route following intuitive and reduces mental effort. North Up feels more natural when comparing positions to paper charts. Try both modes and choose based on personal preference and boating style.
How often should I update my chartplotter’s charts?
Update charts at least annually. More frequent updates benefit boaters in areas with rapid changes like coastal inlets where sandbars shift or busy harbors receiving frequent dredging. Check your manufacturer’s recommendations for specific update schedules.
Can I use a modern chartplotter without sonar?
Absolutely. Many boaters use chartplotters purely for electronic chart navigation and position tracking. Adding sonar/fish finder capabilities later is possible with most modern units through software updates or additional transducers.
What should I do if my chartplotter freezes or displays errors?
Restart your unit completely (power down, wait 30 seconds, restart). Check all cable connections ensuring solid connections. Verify your software and chart versions are current. Contact manufacturer support if problems persist after these steps.
How accurate is GPS positioning on chartplotters?
Modern GPS accuracy typically ranges from 5-15 meters under normal conditions. Some units with WAAS (Wide Area Augmentation System) achieve 3-5 meter accuracy. Factors like tree cover, weather, and atmospheric conditions affect accuracy. Occasionally, GPS signals drop or provide erratic information. Combining GPS with visual confirmation and sounder data provides most reliable navigation.
Can I import my own charts into my chartplotter?
Many units support importing charts in standard formats like Insight Genesis or other proprietary formats. Check your manufacturer’s documentation for specific capabilities. Some custom chart sources require special software or specific file formats.
What’s the learning curve for modern chartplotters?
Basic operation (navigation, waypoint creation, route following) becomes intuitive within a few boating trips. Advanced features (radar overlay, AIS integration, sonar interpretation) require more practice and study. Dedicating time to learning your specific unit makes the technology accessible regardless of background.
Conclusion
Learning to read a chartplotter thoroughly takes practice and dedication, but the investment pays substantial dividends in increased safety, navigation confidence, and boating enjoyment. Start with basic screen elements, symbol recognition, and waypoint creation. Gradually incorporate advanced features like sonar and AIS as comfort increases.
Combine your chartplotter with good seamanship, regularly updated charts, and local knowledge from experienced boaters. The most skilled navigators use technology as a sophisticated tool supporting judgment, not replacing attentiveness and critical thinking on the water. With proper understanding and practice, your chartplotter becomes an invaluable navigation companion enhancing every boating adventure.
Content
- Understanding Your Chartplotter’s Main Screen
- Decoding Nautical Chart Symbols: The Language of Navigation
- Creating and Using Waypoints for Efficient Navigation
- Building and Following Routes for Complex Navigation
- Advanced Features: Sonar, Radar, and AIS Integration
- Essential Settings and Customization for Your Boating Style
- Mobile Navigation Apps as Modern Alternatives
- Practical Tips for Effective Chartplotter Use
- FAQ
- Conclusion